Online Data and Child Marriage

A study by UN Global Pulse with the support of the David and Lucile Packard Foundation to explore the value of various online data sources as a new way of gaining insights on child marriage in Ethiopia and India. Scroll through for an overview of the findings.

About This Exploration

Private sector companies in developed countries have often employed online media mining methodologies and practices to understand the needs of their customers, track emerging market trends and monitor their own operations in real-time. It is not yet clear to what extent these methodologies and practices can possibly be repurposed to understand social issues in developing or underdeveloped countries.

This can be attributed to several factors: differing social norms in how digital services are used, their penetration within priority demographics (such as lower income women or children) and the penetration of digital technologies in general. This digital and data divide means that what works in one context at one time does not necessarily work in another at the same time - but might at a later stage when internet penetration, mobile penetration, and digital literacy improve.

Exploratory studies are a useful way to assess the feasibility of a particular approach. This study explores the value of various online data sources as a new way of gaining insights on child marriage. The central question of this research is:

"What insights about child marriage in Ethiopia and India can be extracted out of data that are global in scale and relatively easy to access?"

Child marriage is a topic with unknown levels of relevant “digital signal” in the countries in question. Moreover, while there is a great deal of digital data on the subject - from news media content to Wikipedia entries, or websites with legislative documents – digital information on child marriage is not always easy to access or effectively analyse in ways that can be relevant for development.

With these considerations in mind, the research was framed as exploratory with the hope that it will inform the planning and execution of future data innovation projects. Below is a summary of the results, with notes on the technical processes which were utilized. The findings focus on three (mainly text-based) sources of data: Google search, News media, and Wikipedia.

Google Trends

Search engines represent a common starting point for many people to gain information on a given topic. Google search offers the most comprehensive web portal to query this type of search trend data, which is why it has been used as the primary source of information for this study. Bing also offers a comparable service while Yahoo!, another top search engine, does not offer access to search statistics.

Google Trends allows the user to see how interest in a search query changes over time. It can also highlight differences between cities, countries and between regions in large countries. Google Trends can show the relative popularity of various entities such as a specific film, literary subject or similar. This study analyzed and assessed the availability of signals and type of insights that can be extracted from topics and specific terms related to child marriage. It follows similar studies from Google on influenza and dengue fever epidemics, and our own previous project on migration flows.

  • Topic: A topic in Google Trends encompasses different search criteria related to the same concept. For the topic "child marriage" that includes searches such as "child marriage", "child brides", and "early marriage".
  • Search Term: When finding the trend of a particular search term, the user gets the individual results for exact text strings like "child marriage", "child brides", and "early marriage".

Importantly, all numbers are relative, not absolute numbers, as this is commercially sensitive. This is described by Google as follows:

“Google Trends adjusts search data to make comparisons between terms easier. Otherwise, places with the most search volume would always be ranked highest. To do this, each data point is divided by the total searches of the geography and time range it represents, to compare relative popularity. The resulting numbers are then scaled to a range of 0 to 100.” (source)

“The numbers that appear show total searches for a term relative to the total number of searches done on Google over time. A line trending downward means that a search term's relative popularity is decreasing. But that doesn't necessarily mean the total number of searches for that term is decreasing. It just means its popularity is decreasing compared to other searches.” (source)

Consequently, we will not know if more or fewer searches are made about child marriage, but we can expect to see if it is a topic that is comparatively more or less in focus in people's searches through the years.

The global trend between January 2008 and April 2016 for the topic 'Child marriage' is shown below.

Although Google at times show main news stories at peaks, that is not the case here. We see that the trend is mainly going up, showing an increased comparative interest in child marriage. There are main peaks in the months of September 2013, June 2015, and March 2016.

As Google Trends also makes it possible to look at news searches, YouTube searches, image searches and more individually, it is possible to see whether searches for news about child marriage also peaked in September 2013, June 2015, and March 2016 making it all the more likely that it was (mainstream) news stories that drove the greater interest and number of searches.

Regular Google searches and Google News searches for the topic "Child marriage" share some peaks (notably September 2013 and June 2015), but there are also quite a few differences.

The increased focus on child marriage in September 2013 seems to be driven to some degree by a story about the death of an 8-year old girl bride from Yemen. There was also focus on Nigerian child brides in the news during that same month. In June 2015, mainstream media wrote about child brides in Africa around the Day of the African Child.

Although inconclusive, an assumption can be made that news stories are a factor in driving people's search behaviour, and therefore potentially people's focus of interest for a given period of time. YouTube search trends (not depicted here) also have June 2015 and September 2013 as main peaks.

Case Study: India

Apart from seeing trends in the global search behaviour, this study looked at India as an individual case study. For the topic of “child marriage” a certain seasonal pattern can be observed in the trend line after the year 2011. Discussions on the topic peak during the months of October and November of each year.

Both overall trends and peaks are very different from the global searches, showing great regional differences. Breaking it further down also shows big differences between Indian states.

A last test we do with the Google Trends data is to see if local differences in searches correlate with differences in the prevalence of child marriage. We compare the Google Trends data to a census completed for India in 2011 that looks at the age of girls and women married within that year. We also compare both to the National Family Health Survey from 2015-16 (NFHS-4). In NFHS-4, the indicator is the percentage of women aged 20-24 years who were married before the age of 18 - in circa 2011.

In the table below, we show how the states rank within a number of metrics (numbers are ranks, not absolute numbers or percentages). From the left we have Google Trends, then the 2011 Census (Urban, Rural, Total), then NFHS-4 (Urban, Rural, Total), and lastly we have also included Literacy Rate from the Census, as a separate, often mentioned explanatory factor in child marriage rates.

The darker the red, the higher the relative number of searches on Google, the higher the child marriage rate, and the lower the literacy rate.

State Google Trends Census, Urban Census, Rural Census, Total NFHS, Urban NFHS, Rural NFHS, Total Literacy Rate
15 10 11 7
14 10 7 8 3 4 3 2
4 3 4 4 5 7 4 21
3 1 3 3 2 2 2 29
12 18 18 22
13 7 5 6
9 17 17 17 4
18 4 6 7 14
10 16 20 19 6 13 10 17
18 16 16 8
20 19 19 25
2 5 2 2 26
16 2 9 9 8 9 9 18
11 12 13 13 1
8 7 11 11 9 3 6 23
16 8 14 14 7 8 8 9
16 15 16 12
18 11 12 19
5 6 12 12 20
17 17 17 5
7 18 18 18 16
1 13 4 5 27
10 16 14 10
14 15 14 15 13 12 13 11
11 5 7 28
4 6 5 3
13 11 10 10 24
5 14 14 15 13
12 8 1 1 1 1 1 15

From the table above, it is evident to the naked eye that there are some dark rows; states that score poorly across the board. The northern and eastern states of West Bengal, Bihar, Assam, Jharkhand, and Rajastan seem to have some way to go before they are child marriage free, while states like Kerala, Haryana and Tamil Nadu are doing better. Chhattisgarh has the lowest rate of child marriage according to NFHS.

The table above displays some rows in which the colors of individual cells are similar, indicating that the ranking in different variables is also similar. Below we use the Kendall rank correlation coefficient (Kendall's Tau) to measure how much the variables are correlated.

Correlation Matrix
The Kendall rank correlation coefficient matrix above shows how well the rankings in each of the variables correlate. Darker positive numbers means that there is a positive correlation, while darker negative (red) means strong negative correlation. Example of negative correlation: The correlation of -0.44 in the bottom left between Google Trends 2011 and Literacy Rate means that the higher a state ranks in terms of literacy rate, the lower it ranks in relative number of searches on Google for child marriage related topics. That is, people in the best educated states are less likely to search Google for child marriage related topics.

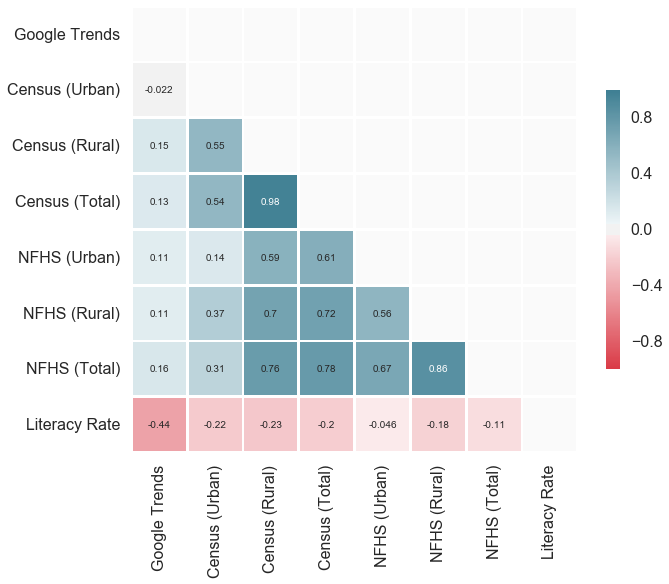
While the Census (Total) and NFHS (Total) correlate strongly (Kendall's Tau: 0.78/Spearman's Rho: 0.92), meaning that states ranking high in one tend to rank high in the other as well, the rank correlations between them and the Google Trends data are much lower.

Based on the very modest correlation between Google Trends data and child marriage prevalence data we do not believe that Google Trends can shed much light on the child marriage trends. Estimating actual child marriage rates is definitely a stretch, but seeing trends at a monthly scale as well as global and sub-national changes much more rapidly than official censuses and major surveys could be a possibility if more research is carried out.

As we have used the Google Trends topic of "Child marriage", we are at a data-driven, predefined combination of seach terms. Nonetheless, further analysis should look at other time periods and combinations of individual search terms.

For this analysis, data from Ethiopia was insufficient at sub-national level, and only Addis Ababa is included in the subregional level. The search trend since January 2008 can be seen below. January 2009 was the month where child marriage related searches were most popular.

Quid: Media Trends

Quid is a business intelligence platform that allows interactive exploration of trends and opinions of arbitrary topics. The data used as input is a large aggregation of English language news articles (company filings and patents are also available).

Quid makes it possible to make sense of a large corpus of news stories related to a topic of interest. This is initially based on a set of keywords which returns a large number of news stories which match the keywords in a selected time period. The purpose is to reveal the structure of the narrative within that large set of news stories that could not be revealed through manually examining the documents. This is extremely valuable for many situations whereby a country office maintains a manual list of important publications including blogs and newspapers and these sources are monitored manually. Quid allows this to be done in a systematic and automated way, with the news content being augmented in several ways including extraction of important organisations, individuals, text sentiment and social sharing through various platforms such as Facebook, Twitter and blogs.

Document Clustering

In the first instance the Quid platform returns a set of news articles that match a keyword search and clusters similar documents together into groups. In order to find this high level structure in a set of documents it is possible to construct a network in which each node represents a document and the links between them are determined by the similarity in their language. This means that two documents with closely related subjects or meanings will have a strong link and two unrelated documents will have a very weak or no link. An example of two articles with a fairly strong link (and grouped in the same cluster) is the linguistic connection between "Rajasthan goes full steam ahead to check child marriages" and ""Rajasthan admin gears up to check child marriages on Akshaya Tritiya".

There exist several algorithms that are able to analyse the connections between large numbers of nodes in a large network (the nodes might represent people or documents or another class of entities) and separate the network into distinct communities. The members of each community have many connections between one another but fewer with members of other communities.

Case Study - India

The study analyzed searches for keywords such as "child bride", "child brides", "child marriage", "child marriages", "early marriage", and "early marriages" in news articles from India.

News from different sources in the platform are provided by news aggregators and are based on the degree of web traffic. Invariably high rank and low rank distinguishes between international news sources and outlets that are more regionally focused. In the context of India, the ranks are defined below along with some example sources

  • Rank 1: Top International, national and business news sources e.g. Times of India, Reuters India, Economic Times, Indian Express, Hindustan Times, Outlook India, Financial Express, International Business Times India, Indiatimes, TimesNow.tv
  • Rank 2: Top regional sources e.g. Sys-Con India, The Hindu, PharmaBiz, NDTV, Livemint.com, The Statesman, Hindu Business Line, Calcutta Telegraph, Deccan Herald, India Infoline
  • Rank 3: A broad range of news sources e.g. Business Standard India, Yahoo! India, MedIndia, ZeeNews.com, NewKerala.com, Sify, ADVFN India, NetIndia123.com, Asian Hospital & Healthcare Management, Siasat Daily
  • Rank 4: News wires with a local focus e.g. BizWire Express, ProKerala.com, PressReleasePoint, The Freepress Journal, Web Newswire, Daily Excelsior.com, Mid Day, Millennium Post, Kashmir Times, Pune Mirror

The analysis begins by selecting news stories and blogs that match the taxonomy over the period 23 August 2013 and 1 May 2016. For India, this results in 4,252 different stories (each story can be published in several outlets).

The figure below shows a representation of these 4,252 stories. Each node in the network represents a news story and each colour represents a grouping of articles that corresponds to a topic. The size of each node represents its degree (how many links it has to other stories).

News articles in India
News articles about child marriage in India clustered by content similarity. The six named and coloured clusters are the ones with the most stories.

News articles in India
News articles about child marriage in India clustered by content similarity. Coloured by sentiment. Green=positive, yellow=neutral, red=negative.

Especially the "A minor married" and "Crime and statistics" clusters are negative. Both consist of reports of child marriages where the former usually carries stories about individual cases, and the latter about numbers of criminal cases.

The above visualization highlights the six clusters with most relevant stories on “Child Marriage.” The largest one is entitled "Culture and Hinduism" (3.9%). It's very far from any of the other major clusters, indicating that the stories in there have only few things in common with the others. The three clusters in the top right of the network are very close and as their content is similar. "Child marriage averted" (3.6%), "A minor married" (3.3%), and "Action against child marriage" (2.6%) all carry stories about the fight against child marriage.

When we break those six clusters down by source, we see that The Hindu, Times of India, and New Indian Express have written the most about child marriage. Interestingly, roughly half of the stories from The Hindu are about "Child marriage averted". The sources most likely to write about the UN, NGOs and foreign government efforts to promote equality are Times of India, BizWire Express, and PressReleasePoint.

News articles in India
News articles about child marriage in India by source.

In terms of traction on social media and the number of times the same story was published in different outlets, we can clearly observe the phenomenon of a piece going viral. The story which has been shared the most is "16 Shocking misconceptions about Hinduism" while a UNICEF story about child marriages being on the rise in Kerala was the most widely reported by news outlets.

Sharing of news articles in India
News articles about child marriage in India by number of shares.

If we zoom in on the UNICEF story about increasing numbers of child marriages in Kerala, we see that it is closely related to a number of stories.

News articles related to the UNICEF story about child marriages in Kerala
News articles related to the UNICEF story about child marriages in Kerala. A node - a story - is bigger the more times it's been reported.

Above, we highlight "Child Marriage on the Rise in Kerala: UNICEF" and all its "neighbours". The stories most similar to that story are

This analysis revealed the importance of using text analytical methods on a large corpus of news articles to reveal interesting patterns not previously identified by reading news stories individually on a day-to-day basis. An organisation like UNICEF will undoubtedly already know that their story about Kerala had gotten a lot of traction, but seeing how it fits into the larger narrative in news media could help improve subsequent stories and follow-ups.

Data derived from Quid may not be available for all countries in the foreseeable future, especially as long as only English language news items are included. However, scraping open source news and partnering with news outlets could provide a timely and accurate analysis of topics of interest for sustainable development.

Due to the low number of news-related information found for Ethiopia (around 100), an analysis could not be completed for this country.

Wikipedia

Wikipedia is an open knowledge base maintained by volunteer contributors. It is one of the most popular sites on the Internet. The information contained within each article is extremely rich and can easily be accessed in a systematic way via a dedicated API along with myriad meta-data for that specific page such as the number of views and a full log of edits.

Language Pageviews per Month Total Articles Edits per Month
English 7,398,399,652 5,139,050 3,417,483
Hindi 9,745,491 105,225 10,848
Marathi 2,349,388 44,257 3,250
Amharic 412,465 13,659 259

With the focus of our project being on India and Ethiopia, we looked at the breadth and use of Wikipedia in English, Hindi, Marathi, and Amharic. Data is from April 2016. As expected, English

  • is more widely used (759 times as many pageviews as Hindi)
  • is much bigger (49 times as many articles as Hindi)
  • has many more edits (315 times as many edits as Hindi)

In other words, the scale of English Wikipedia is phenomenal. To put it further into context, English has roughly 6-7 times as many pageviews as the next most used Wikipedia languages, Japanese, Spanish, German, and Russian. That is not to take anything away from the work going into non-English languages, though. 10 million montly pageviews for Hindi Wikipedia is a staggering number. As is 13,000 individual articles in Amharic.

This study presents three types of Wikipedia exploration, complete working examples with step-by-step technical guides, each providing a different kind of insight:

  • Word Cloud: visual representation of the most prominent terms in child marriage pages
  • Links: visual representation of all related Wikipedia pages, showing what articles contributors deem important when publishing on the topic of child marriage
  • Clicks: visual representation of child marriage pages' incoming and outgoing clicks, to understand the types of articles readers find interesting

Word cloud and link explorations are done for three languages - English, Hindi and Marathi - while click exploration is done for English only due to the underlying dataset not being available in other languages.

Word Cloud

Word clouds can at times be great for getting a sense of what is in a document or a whole corpus of documents. Below visualization shows that the English language Wikipedia page on child marriage mentions of the words "girls", "age", "years" and "law". That "girls" and not "children" are the main signifier tells us a lot about the nature of the problem. Relevant to this exploration, we also note that "India" gets highlighted more often than other countries.

English:

Initially, we see the same pattern in Hindi as in English. Just like in English, the page mentions "विवाह" (marriage) more often than any other word, but after that comes "बाल" (child), "प्रतिशत" (percent), "साल" (year) and "१८" (eighteen). The text seems very factual, and a quick look at the page will also confirm that it is a very short Wikipedia entry and that it mainly refers to statistics from UNICEF.

Hindi:

For the Marathi Wikipedia page on child marriage, "बालविवाह" (literally, child marriage) is in focus with "कायदा" (law) the second most used word, followed by "प्रतिबंध" ([child marriage] prevention), "विवाह" (marriage) and "न्यायालय" (court). As can be gleaned from these most used words, the article mainly focuses on Indian child marriage laws.

Marathi:

Links

The network of links coming into and leading out of the child marriage Wikipedia article can provide indications of what type of information contributors find relevant to child marriage. The left hand side column consists of pages that mention and link to the child marriage page while the right hand side consists of pages that the Wikipedia child marriage page writes about and links to.

Clicks

The previous section analyzed all current links, leading into or out of the Child Marriage Wikipedia page and what type of articles contributors to these pages found interesting. However, in order to understand what pages are important from a reader’s perspective, we proceed to analysing the clickstream data. The below visualization represents the breakdown of what pages readers accessed before coming to the Wikipedia child marriage page (on the left hand side) and what links they clicked on and went on browsing after leaving the Wikipedia child marriage page (on the right hand side).

In the English language version above, we see that by far the biggest website to send users to the Wikipedia page on child marriage is Google. If we look at Wikipedia pages, most people came from the pages on Marriageable age, Marriage, Child sexual abuse, Child Bride (American movie from 1943), and Aisha (one of Muhammad's wifes). Most people who read the child marriage page follow links to Ellen Terry (Shakespearean actress), List of child brides, Child Marriage (American documentary from 2005), Teenage pregnancy, and Child sexuality.

Wikipedia is widely used as a knowledge hub around the world (and is free to use with many phone companies), and knowing how people navigate important issues like child marriage online can be used for both advocacy and campaign monitoring.

There is also the possibility that the number of users visiting and editing a range of pages can be an indicator of the level of child marriages or an indicator of how many people are for or against child marriage at a national level. A next step in the use of Wikipedia to gain insights on child marriage would be to correlate national pageview numbers with the best available ground-truth data.

For more on the use of Wikipedia data, see also UNECE's Wikistats project, which looks at UNESCO heritage sites.

Wikipedia Code

This project was intended to be replicable for issues other than child marriage, in order to enable additional research and new applications. Below, we describe the Wikipedia analysis — including examples of code — from the data retrieval through output stages. This information may be useful in designing projects that follow a similar template.

Word Cloud

Data

We will fetch two types of data in three languages (English, Hindi and Marathi) to create word clouds:

  • Child marriage Wikipedia pages and
  • Stop word lists

Data - Wikipedia Pages

Wikipedia pages can be conveniently fetched via an API with HTTP calls like

https://en.wikipedia.org/w/api.php?action=parse&redirects=&prop=text&page=Child_marriage&format=json

For now we won't make API requests from client side but will rather go to the server's command line and execute three downloads:

$ wget --output-document=en.json "https://en.wikipedia.org/w/api.php?action=parse&redirects=&prop=text&page=Child_marriage&format=json" # English
$ wget --output-document=hi.json "https://hi.wikipedia.org/w/api.php?action=parse&redirects=&prop=text&page=%E0%A4%AC%E0%A4%BE%E0%A4%B2_%E0%A4%B5%E0%A4%BF%E0%A4%B5%E0%A4%BE%E0%A4%B9&format=json" # Hindi
$ wget --output-document=mr.json "https://mr.wikipedia.org/w/api.php?action=parse&redirects=&prop=text&page=%E0%A4%AC%E0%A4%BE%E0%A4%B2%E0%A4%B5%E0%A4%BF%E0%A4%B5%E0%A4%BE%E0%A4%B9&format=json" # Marathi

Result of each one of these three commands is a JSON file that holds page's text in the ["parse"]["text"]["*"] field.

Data - Stop Word Lists

Our word clouds would look rather silly if we wouldn't remove common words that hold little meaning in each respective language. That's why we'll also download lists of such words and apply them in our code. We'll go to the Ranks.nl website and copy/paste them into files named (languge-code).stopwords.txt. They will look something like this:

English:

$ head en.stopwords.txt -n10
a
able
about
above
abst
accordance
according
accordingly
across
act

Hindi:

$ head hi.stopwords.txt -n10
के
का
एक
में
की
है
यह
और
से
हैं

Marathi:

$ head mr.stopwords.txt -n10
आहे
या
आणि
व
नाही
आहेत
यानी
हे
तर
ते

When we are done with fetching the data, we should have six files on our server:

$ ls
-rw-rw-r-- 1 ubuntu 322K Dec 16 15:49 en.json
-rw-rw-r-- 1 ubuntu 4.1K Dec 16 18:04 en.stopwords.txt
-rw-rw-r-- 1 ubuntu 9.0K Dec 16 15:50 hi.json
-rw-rw-r-- 1 ubuntu  965 Dec 16 18:05 hi.stopwords.txt
-rw-rw-r-- 1 ubuntu  54K Dec 16 15:51 mr.json
-rw-rw-r-- 1 ubuntu 1.3K Dec 16 18:06 mr.stopwords.txt

Code

When we started the word cloud exploration we were hoping to do it by using one of Python word cloud projects. It generally worked well... until it was time to add Devanagari script for Hindi and Marathi. We spent some time on trying to make non-latin script to display properly but ultimately gave up and went JavaScript way. As one might expect, there are many more web users than Python coders that make use of the script we need... Devanagari web browser support is therefore better and we could finish our project!

We'll use four libraries to make our word clouds:

HTML

We will embed our main code into a very basic HTML document with one main distinction - we need to load a font with Devanagari characters. We will use Google Fonts service for that and choose font Glegoo.

<!DOCTYPE html>
<html lang="en">
  <head>
    <title>Child Marriage Wikipedia Page Word Cloud</title>

    <!-- jQuery -->
    <script src="jquery/jquery.min.js"></script>

    <!-- D3.js -->
    <script src="js/d3.v3.min.js"></script>

    <!-- D3.js cword cloud plugin -->
    <script src="js/d3.layout.cloud.js"></script>

    <!-- XRegExp -->
    <script src="js/xregexp-all-min.js"></script>

    <!-- Load Glegoo front from Google Fonts -->
    <link href='https://fonts.googleapis.com/css?family=Glegoo:400,700&subset=latin,devanagari' rel='stylesheet' type='text/css'>

  <style>
    ... styles ...
  </style>

  <script type="text/javascript">
    ... JavaScript code ...
  </script>
  </head>
  <body>
    <div class="wordbox">English:<br/><svg id="svg-en" class="word-cloud"></svg></div>
    <div class="wordbox">Hindi:<br/><svg id="svg-hi" class="word-cloud"></svg></div>
    <div class="wordbox">Marathi:<br/><svg id="svg-mr" class="word-cloud"></svg></div>
  </body>
</html>

Styles

Custom styling takes care of two things, cloud centring and inclusion of Glegoo font.

.word-cloud {
  display: block;
  margin: auto;
}

.wordbox {
  border: 1px solid #c0c0c0;
  margin: 10px;
  padding: 10px;
  font-family: 'Glegoo', serif !important;
}

JavaScript

We start off by setting some basic variables for each of three languages. We use sizeMultipliers variable in lieu of normalizing the word count data - admittedly not the most elegant solution, but good enough in our case. An important aspect of this number is that we may not set it too high... if it is, some words will not appear in the cloud.

$( document ).ready(function() {

  var fill = d3.scale.category20();
  var languages = ['en','hi','mr'];
  var sizeMultipliers = [0.5,15,5];
  var fonts = ['Impact', 'Glegoo', 'Glegoo']

Note, that we use a JavaScript closure here - (function(){...})() - for quick isolation and faster execution of each of the three asynchronously loaded datasets.

  for (var lx in languages) {
    (function(){
    var lang = languages[lx];
    var sizeMulti = sizeMultipliers[lx];
    var langFont = fonts[lx];
    var layout;

We go on by loading stopwords into an array, adding a few we found annoying in these particular datasets by hand and loading the Wikipedia page in JSON format.

    $.get('data/'+lang+'.stopwords.txt', function(stopW) {

      var stopWordsArr = XRegExp.matchChain(stopW, [XRegExp("[\\p{Alphabetic}\\p{Nd}\\{Pc}\\p{M}]+", "g")])
        .concat(["edit","uk","org","pdf"]);

The Wikipedia pages get sent to us in HTML format, so we need to get rid of links and HTML tags.

      $.get( 'data/'+lang+'.json', function( data ) {
        var html = data["parse"]["text"]["*"];
        var linkRegex = /(https?:\/\/([-\w\.]+)+(:\d+)?(\/([\w\/_\.]*(\?\S+)?)?)?)/ig;
        var tagRegex = /<\/?[^>]+>/ig;
        var text = html.replace(linkRegex, " ").replace(tagRegex, " ").toUpperCase();

        var width = 800, height = 640;
        var fill = d3.scale.category20();

We perform word count over the array of words we extract from the page's text.

        var wordsArr = XRegExp.matchChain(text, [XRegExp("[\\p{Alphabetic}\\p{Nd}\\{Pc}\\p{M}]+", "g")]);

        var wordCounts = wordsArr.reduce(function(map, word){
            map[word] = (map[word]||0)+1; return map;
          }, Object.create(null));

We set stopword's counts to 0 so they won't appear signifficant.

        stopWordsArr.map(function(val){
          wordCounts[val] = 0;
        })

We pass on words that are not stopwords or Arabic numbers (Devanagari numbers are OK since they are not used for system purposes) and create array of top 100 words sorted by counts.

        var sortable = [];
        for (var wordC in wordCounts) {
          if ($.inArray(wordC.toLowerCase(), stopWordsArr) < 0) {
            if (isNaN(parseInt(wordC))) {
              sortable.push([wordC, wordCounts[wordC]]);
            }
          }
        }
        sortable.sort(function(a, b) {return b[1] - a[1]});

        sortable.splice(100, sortable.length); // Top 100 words only

We activate the word cloud plugin while tweaking some of parameters to our liking - apply sizeMulti multiplier to counts, add some padding between words and disable rotation.

        layout = d3.layout.cloud()
          .size([width, height])
          .words(sortable.
            map(function(d) {
              return {text: d[0], size: d[1]*sizeMulti, lang: lang};
            }))
          .padding(5)
          .rotate(0)
          .font(langFont)
          .fontSize(function(d) { return d.size; })
          .on("end", function (words) {
            d3.select("body").select("#svg-"+words[0].lang)
              .attr("width", layout.size()[0])
              .attr("height", layout.size()[1])
              .append("g")
              .attr("transform", "translate(" + layout.size()[0] / 2 + "," + layout.size()[1] / 2 + ")")
              .selectAll("text")
              .data(words)
              .enter().append("text")
              .style("font-size", function(d) { return d.size + "px"; })
              .style("font-family", langFont)
              .style("fill", function(d, i) { return fill(i); })
              .attr("text-anchor", "middle")
              .attr("transform", function(d) {
                return "translate(" + [d.x, d.y] + ")rotate(" + d.rotate + ")";
              })
              .text(function(d) { return d.text; });
            });

        layout.start();
      });
    });
  })();
  }
});

And we're done!

Links

Network of links coming into and leading out of the child marriage Wikipedia article will give us some sense of what article contributors find relevant.

Data

Just like in Word Count example we will fetch our data via the Wikipedia's API calls. However, this time around we'll keep all the communication on the client side. Since we're interested in where the Child Marriage page links to as well as what links to it, we'll be performing two requests per language:

Code

We will create our visualization with jQuery, D3.js. No special D3.js plugins are required as clustering and dendrogram layout is part of its core.

HTML

As usually we'll make a basic HTML document:

<!DOCTYPE html>
<html lang="en">
  <head>
    <title>Child Marriage Wikipedia Page Link Exploration</title>

    <!-- jQuery -->
    <script src="jquery/jquery.min.js"></script>

    <!-- D3.js -->
    <script src="js/d3.v3.min.js"></script>

  <style>
    ... styles ...
  </style>

  <script type="text/javascript">
    ... JavaScript code ...
  </script>
  </head>
  <body>
    <p>
    <div class="linkbox">English:<svg class="links-layout" id="links-en"></svg></div>
    <div class="linkbox">Hindi:<svg class="links-layout" id="links-hi"></svg></div>
    <div class="linkbox">Marathi:<svg class="links-layout" id="links-mr"></svg></div>
    </p>
  </body>
</html>

Styles

Styling needs to take care of:

  • nodes,
  • links and
  • graph placement within the page.
It's important to note that there must be two types of nodes and links that will look the same but have distinct classes. Because of our double-dendrogram (see below in JavaScript) approach incoming links and nodes mush have different class than outgoing, hence .nodeIn, .nodeOut {...} and .linkIn, .linkOut {...}

.linkbox {
  border: 1px solid lightgray;
  margin: 10px;
  padding: 10px;
}

.links-layout {
  display: block;
  margin: auto;
}

.nodeIn circle, .nodeOut circle {
  fill: #fff;
  stroke: steelblue;
  stroke-width: 1.5px;
}

.nodeIn, .nodeOut {
  font: 10px sans-serif;
}

.linkIn, .linkOut {
  fill: none;
  stroke: #ddd;
  stroke-width: 1.5px;
}

JavaScript

Data fetching is packed away in the fetchLinks function. It takes care of retrieving links and backlinks while managing result paging. It takes six arguments:

  • buf - buffer variable that will hold the result array through recursive paging calls [var],
  • linkType - type of links to fetch [String:'links'|'backlinks'],
  • lang - what language's API to hit [String:'en'|'hi'|'mr'|...],
  • title - title of the Wikipedia page to fetch [String],
  • req - variable to pass request information between recursive paging calls; should be null on first call [Object],
  • callback - function to call when all data is fetched [function (data){}]

Please note that Wikipedia API calls requre you to identify yourself via the Api-User-Agent header. You should assign it a working email address - change <your-email-here> to an email address that Wikipedia team can reach you at in case they need to.

function fetchLinks(buf, linkType, lang, title, req, callback) {

  if (req == null) {
    req = {
    format: 'json',
    action: 'query',
    };
  }

  switch (linkType) {
    case 'backlinks':
      req.bltitle = title;
      req.bllimit = '100';
      req.list = linkType; //'backlinks',
      break;
    case 'links':
      req.titles = title;
      req.pllimit = '100';
      req.prop = linkType; //'links',
  }

  $.ajax({
    url: '//'+lang+'.wikipedia.org/w/api.php',
    data: req,
    cache: true,
    dataType: 'jsonp',
    headers: { 'Api-User-Agent': '<your-email-here>' },
    success: function(result)
    {
      switch (linkType) {
        case 'backlinks':
          buf = buf.concat(result.query.backlinks);
          break;
        case 'links':
          for (page in result.query.pages) {
            if (result.query.pages[page].title == title) {
              buf = buf.concat(result.query.pages[page].links);
            }
          }
      }
      if (result.continue != undefined) {
        switch (linkType) {
          case 'backlinks':
            req.blcontinue = result.continue.blcontinue;
            break;
          case 'links':
            req.plcontinue = result.continue.plcontinue;
        }
        fetchLinks(buf, linkType, lang, title, req, callback);
      } else {
        callback(buf);
      }
    },
    error: function(jqXHR, st, er) {
      console.error("Error making XMLHttpRequest.");
      console.error(jqXHR);
      console.error(st);
      console.error(er);
    }
  });

}

We start off with iterating through the three languages, setting up corresponding variables. Because child marriage Wikipedia pages are not of same size and complexity we scale the drawing canvas height depending on language - English takes much more space than Hindi or Marathi.

$( document ).ready(function() {

  var languages = ['en','hi','mr'];
  var titles = ['Child marriage', 'बाल विवाह', 'बालविवाह'];
  var heights = [4500, 600, 600];

  for (var lx in languages) {
    (function(){
      var language = languages[lx];
      var title = titles[lx];
      var height = heights[lx];
      var width = 960;

After we transfer both lists, we sort them alphabetically. We'll be using a simple greater-than/lower-than comparison operator which is good enough for demonstration purposes, though beware, it does not work properly on Unicode strings. A better option might be String.prototype.localeCompare() but we'll forgo it for compatiblity reasons.

      var backLinks = [];
      var forwardLinks = [];
      fetchLinks(forwardLinks, 'links', language, title, null, function (flData) {
        fetchLinks(backLinks, 'backlinks', language, title, null, function (blData) {

          titleSort = function(a, b) { return a.title > b.title ? 1 : ( (a.title < b.title) ? -1 : 0 ) };
          blData.sort(titleSort);
          flData.sort(titleSort);

D3.js library has many layouts available for relation visualization, however at the moment none of them fit our need of drawing a central node with many inputs and many outputs at the same time. The closest option is the dendrogram layout, which draws half of what we need. So we'll use that one... twice. All computation and subsequent drawing methods will be called on each side of the diagram - incoming and outgoing - with one being transposed over the vertical axis.

D3.layout.cluster() creates the core layout object we'll use to calculate node and link locations.

          var clusterIn = d3.layout.cluster()
            .size([height, width]);
          var clusterOut = d3.layout.cluster()
            .size([height, width]);

Diagonal projection is the first place where we make distinction between incoming and outgoing node locations. Incoming ones will be placed 1/6 left and outgoing ones 1/6 right of mid-canvas.

          var diagonalIn = d3.svg.diagonal().projection(function(d) { return [width/2-d.y/6, d.x]; });
          var diagonalOut = d3.svg.diagonal().projection(function(d) { return [width/2+d.y/6, d.x]; });

We populate the incoming and outgoing branch with node data from previous API requests.

          var inBranch = {
            name: title,
            children: [],
          };
          var outBranch = {
            name: title,
            children: [],
          };
          for (bl in blData) {
            backlink = blData[bl]
            inBranch.children.push({
              name: backlink.title
            });
          }
          for (fl in flData) {
            forwardlink = flData[fl]
            outBranch.children.push({
              name: forwardlink.title
            });
          }

Calling .nodes() and .links() method of layout clustering object calculates the x/y location of all nodes and links.

          var nodesIn = clusterIn.nodes(inBranch),
              linksIn = clusterIn.links(nodesIn);
          var nodesOut = clusterOut.nodes(outBranch),
              linksOut = clusterOut.links(nodesOut);

We get the SVG element from HTML and size it accordingly.

          var svg = d3.select("#links-"+language)
            .attr("width", width + 40)
            .attr("height", height)
            .append("g")
            .attr("transform", "translate(20,0)");

We apply previously defined diagonal projection to links and the same mid±1/6 translation to nodes.

          var linkIn = svg.selectAll(".linkIn")
            .data(linksIn)
            .enter().append("path")
            .attr("class", "linkIn")
            .attr("d", diagonalIn);
          var linkOut = svg.selectAll(".linkOut")
            .data(linksOut)
            .enter().append("path")
            .attr("class", "linkOut")
            .attr("d", diagonalOut);

          var nodeIn = svg.selectAll(".nodeIn")
            .data(nodesIn)
            .enter().append("g")
            .attr("class", "nodeIn")
            .attr("transform", function(d) {
              return "translate(" + (width/2-d.y/6) + "," + d.x + ")"; })
          var nodeOut = svg.selectAll(".nodeOut")
            .data(nodesOut)
            .enter().append("g")
            .attr("class", "nodeOut")
            .attr("transform", function(d) {
              return "translate(" + (width/2+d.y/6) + "," + d.x + ")"; })

          nodeIn.append("circle")
            .attr("r", 4.5);
          nodeOut.append("circle")
            .attr("r", 4.5);

And we finally add Wikipedia page names next to nodes, making sure that clicks are taking users to the actual page.

          nodeIn.append("text")
            .attr("cursor", "pointer")
            .on("mouseup", function (d) { window.open("https://"+language+".wikipedia.org/wiki/"+d.name); })
            .attr("dx", -8)
            .attr("dy", 3)
            .style("text-anchor", "end")
            .text(function(d) { return d.children ? "": d.name; });
          nodeOut.append("text")
            .attr("cursor", "pointer")
            .on("mouseup", function (d) { window.open("https://"+language+".wikipedia.org/wiki/"+d.name); })
            .attr("dx", function(d) { return d.children ? 0 : 8; })
            .attr("dy", function(d) { return d.children ? -10 : 3; })
            .style("text-anchor", function(d) { return d.children ? "middle" : "start"; } )
            .text(function(d) { return d.name; });

          d3.select(self.frameElement).style("height", height + "px");
        });
      });
    })();
  };

});

And we're done!

Clicks

In previous section we've found what all the current links are, leading into or out of the Child Marriage Wikipedia page. However, that does not tell us much about which of those are interesting to people. To get some sense of what, where and how often catches people's attention in relation to the page, we proceed to analysing clickstream data.

Data

We fetch the data from February 2015 English Wikipedia Clickstream:

$ wget --output-document=wiki-clickstream-jan-feb-2015.zip https://ndownloader.figshare.com/articles/1305770/versions/12

We unzip the wiki-clickstream-jan-feb-2015.zip archive and get a few files:

$ unzip wiki-clickstream-jan-feb-2015.zip
Archive:  wiki-clickstream-jan-feb-2015.zip
 extracting: 2015_01_clickstream.tsv.gz
 extracting: London_Sankey.png
 extracting: 2015_02_clickstream_preview.tsv
 extracting: 2015_01_clickstream_preview.tsv
 extracting: 2015_02_clickstream.tsv.gz

The data file we're interested in (2015_02_clickstream.tsv.gz) is gzipped, so we ungzip it and end up with a tab-separated file named 2015_02_clickstream.tsv:

$ gunzip 2015_02_clickstream.tsv.gz
$ ls 2015_02_clickstream.tsv
-rw-rw-r-- 1 ubuntu 1.3G Mar  8 22:36 2015_02_clickstream.tsv

2015_02_clickstream.tsv contains the entire February 2015 English Wikipedia click counts. For our case, we only need to extract the ones coming into or leaving the Child_marriage Wikipedia page:

$ head 2015_02_clickstream.tsv -n1 >Child_marriage.tsv # extract first line only - field names
$ grep -P "\tChild_marriage\t" 2015_02_clickstream.tsv | sort -t$'\t' -k3 -nr >>Child_marriage.tsv # append sorted lines containing Child_marriage

The result is a file named Child_marriage.tsv that we'll use for our visualization and looks something like this:

$ csvtool -t TAB readable Child_marriage.tsv | head -n10
prev_id  curr_id  n    prev_title                           curr_title                                                 type
         411381   8844 other-google                         Child_marriage                                             other
         411381   1094 other-empty                          Child_marriage                                             other
         411381   399  other-other                          Child_marriage                                             other
         411381   350  other-bing                           Child_marriage                                             other
         411381   345  other-yahoo                          Child_marriage                                             other
         411381   331  other-wikipedia                      Child_marriage                                             other
350865   411381   282  Marriageable_age                     Child_marriage                                             link
19728    411381   214  Marriage                             Child_marriage                                             link
411381   213396   205  Child_marriage                       Ellen_Terry                                                link

Now we have the data we need to visualize clicks in and out of Wikipedia's child marriage page and we can move on to...

Code

We will create our visualization with jQuery, D3.js and its Sankey Plugin.

HTML

We'll create the basic HTML document to hold our styles and code:

<!DOCTYPE html>
<html lang="en">
  <head>
    <title>Child Marriage Wikipedia Page Exploration</title>

    <!-- jQuery -->
    <script src="jquery/jquery.min.js"></script>

    <!-- D3.js -->
    <script src="js/d3.v3.min.js"></script>

    <!-- Sankey plugin for D3.js -->
    <script src="js/sankey.js"></script>

  <style>
    ... styles ...
  </style>

  <script type="text/javascript">
    ... JavaScript code ...
  </script>
  </head>
  <body>
    <p id="sankey-chart"></p>
  </body>
</html>

Styles

Custom chart styling needs to take care of only three main points:

  • nodes,
  • links and
  • chart placement in the entire page:

/* nodes style */
.node rect {
  cursor: move;
  fill-opacity: .9;
  shape-rendering: crispEdges;
}

.node text {
  text-shadow: 0 1px 0 #fff;
}

/* links style */
.link {
  fill: none;
  stroke: #000;
  stroke-opacity: .2;
}

.link:hover {
  stroke-opacity: .5;
}

/* chart placement */
#clicks-sankey {
  display: block;
  margin: auto;
}

JavaScript

JavaScript code is a modified version of Mike Bostock's Sankey Diagrams.

We start off by binding our code to the "ready" event of the webpage document and loading the data we prepared in one of the previous steps:

$( document ).ready(function() {

  d3.tsv("data/Child_marriage.tsv", function(tsv) {

When the data is loaded we start by transforming data from tabular into network form. Since we have only one central node (Child_marriage) and every other node links either from or to this node, we can simplify the process by just appending two types (to-root and from-root) of nodes and links to their respective arrays.

    var root = "Child_marriage";
    nodes = [{name:root}]
    links = [];

    var lines = tsv.length;
    for (var i = 0; i < lines; i++) {
      var rowFrom = tsv[i].prev_title;
      var rowTo = tsv[i].curr_title;
      var rowWeight = parseInt(tsv[i].n);

      var id = nodes.length;
      if (rowFrom == root) {
        nodes[id] = {name:rowTo};
        links.push({source: 0, target: id, value:rowWeight});
      } else {
        nodes[id] = {name:rowFrom};
        links.push({source: id, target: 0, value:rowWeight});
      }
    }

We set the basic SVG element's properties:

    var margin = {top: 1, right: 1, bottom: 6, left: 1},
        width = 960 - margin.left - margin.right,
        height = 1500 - margin.top - margin.bottom;

We set the popup text format and node color scale:

    var formatNumber = d3.format(",.0f"),
        format = function(d) { return formatNumber(d) + " clicks"; },
        color = d3.scale.category20();

Create the enclosing SVG element...

    var svg = d3.select("#sankey-chart").append("svg")
        .attr("id", "clicks-sankey")
        .attr("width", width + margin.left + margin.right)
        .attr("height", height + margin.top + margin.bottom)
        .append("g")
        .attr("transform", "translate(" + margin.left + "," + margin.top + ")");

Create the base Sankey diagram...

    var sankey = d3.sankey()
        .nodeWidth(15)
        .nodePadding(10)
        .size([width, height]);

    var path = sankey.link();

    sankey
      .nodes(nodes)
      .links(links)
      .layout(32);

Bind links to data and style them...

    var link = svg
        .append("g")
        .selectAll(".link")
        .data(links)
        .enter().append("path")
        .attr("class", "link")
        .attr("d", path)
        .style("stroke-width", function(d) {
          return Math.max(1, d.dy);
        })
        .sort(function(a, b) {
          return b.dy - a.dy;
        });

    link.append("title")
        .text(function(d) { return d.source.name + " → " + d.target.name + "\n" + format(d.value); });

Bind nodes to data and style them...

    var node = svg.append("g").selectAll(".node")
        .data(nodes)
        .enter().append("g")
        .attr("class", "node")
        .attr("transform", function(d) { return "translate(" + d.x + "," + d.y + ")"; })
        .call(d3.behavior.drag()
        .origin(function(d) { return d; })
        .on("dragstart", function() { this.parentNode.appendChild(this); })
        .on("drag", dragmove));

    node.append("rect")
        .attr("height", function(d) { return d.dy; })
        .attr("width", sankey.nodeWidth())
        .style("fill", function(d) { return d.color = color(d.name.replace(/ .*/, "")); })
        .style("stroke", function(d) { return d3.rgb(d.color).darker(2); })
        .append("title")
        .text(function(d) { return d.name + "\n" + format(d.value); });

    node.append("text")
        .attr("cursor", function(d) { return d.name.startsWith("other-") ? "default" : "pointer"; })
        .on("mouseup", function (d) { if (!d.name.startsWith("other-")) window.open("https://en.wikipedia.org/wiki/"+d.name); })
        .attr("x", -6)
        .attr("y", function(d) { return d.dy / 2; })
        .attr("dy", ".35em")
        .attr("text-anchor", "end")
        .attr("transform", null)
        .text(function(d) { return d.name; })
        .filter(function(d) { return d.x < width / 2; })
        .attr("x", 6 + sankey.nodeWidth())
        .attr("text-anchor", "start");

Nodes can be dragged vertically and function dragmove() facilitates this action:

    function dragmove(d) {
      d3.select(this).attr("transform", "translate(" + d.x + "," + (d.y = Math.max(0, Math.min(height - d.dy, d3.event.y))) + ")");
      sankey.relayout();
      link.attr("d", path);
    }

  });

});

And we're done!

Contact Global Pulse

If you have any questions, please feel free to write us at

info@unglobalpulse.org